The framework for linking taxation and inequality is mature (Piketty, Saez and Zucman; DINA project). EAP is the region where it has not yet been applied at country level. We attempt a stylised pre-tax → post-tax decomposition for 8 of the 17 EAP economies; for the other 9 even that is not feasible from public data.
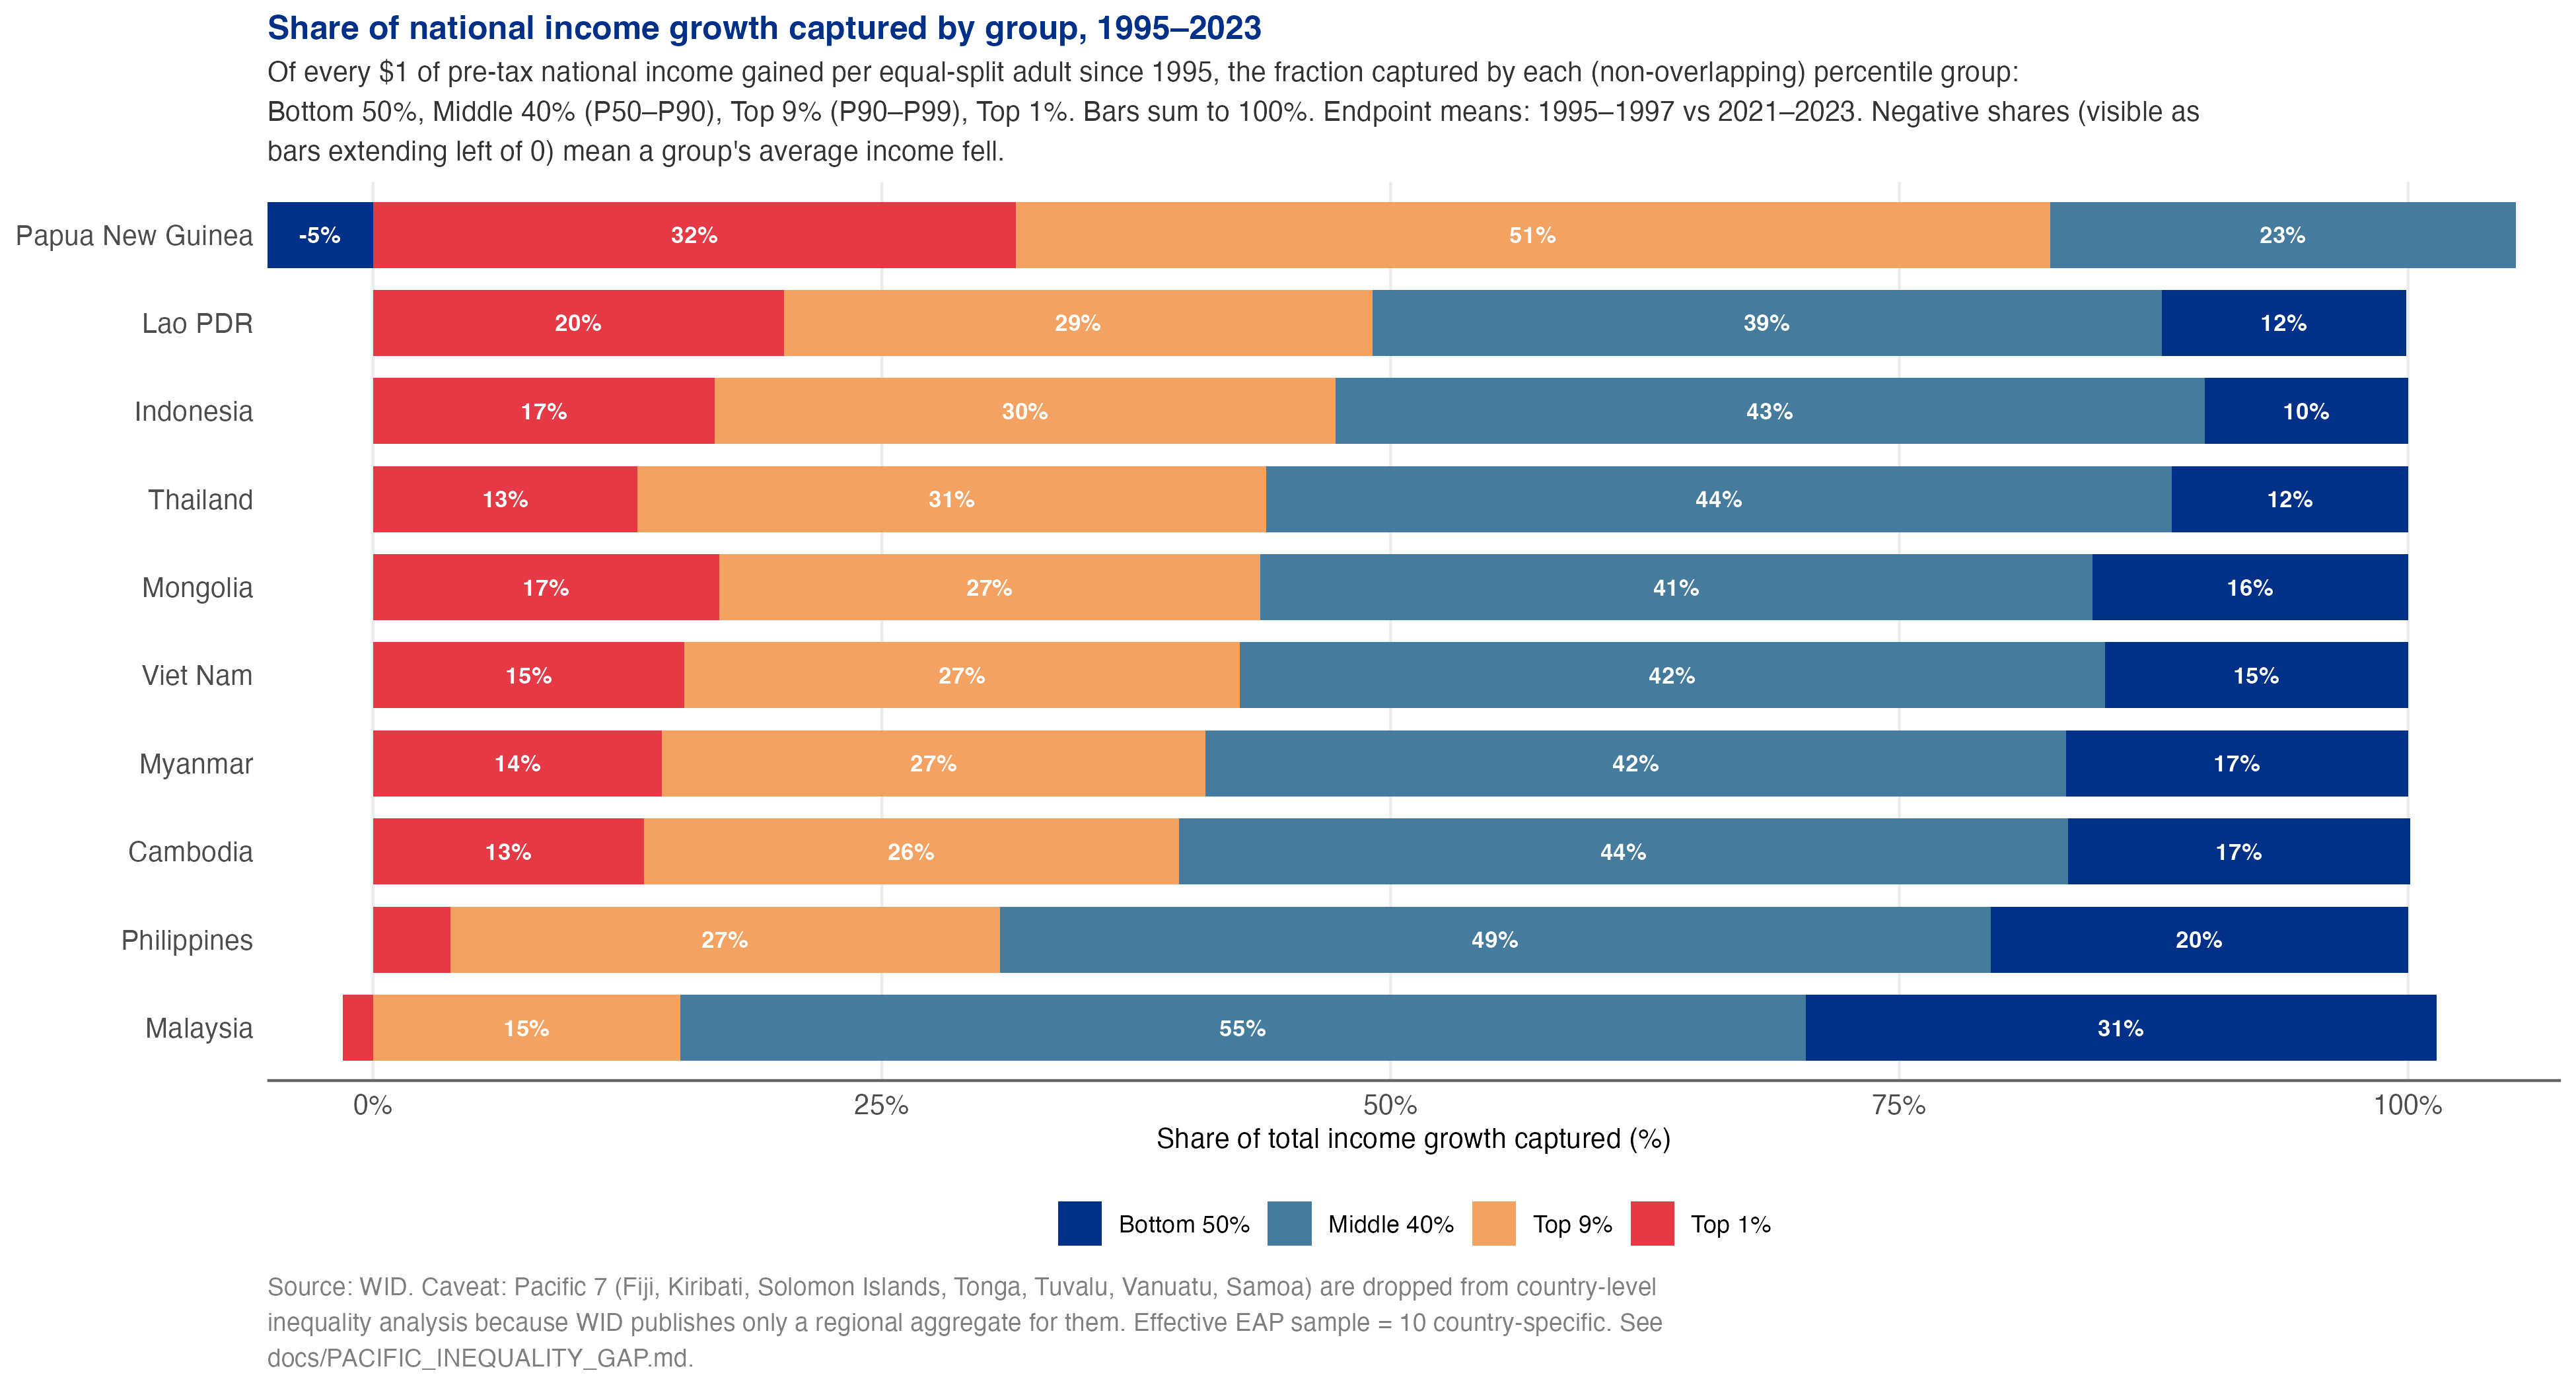
Where the growth went
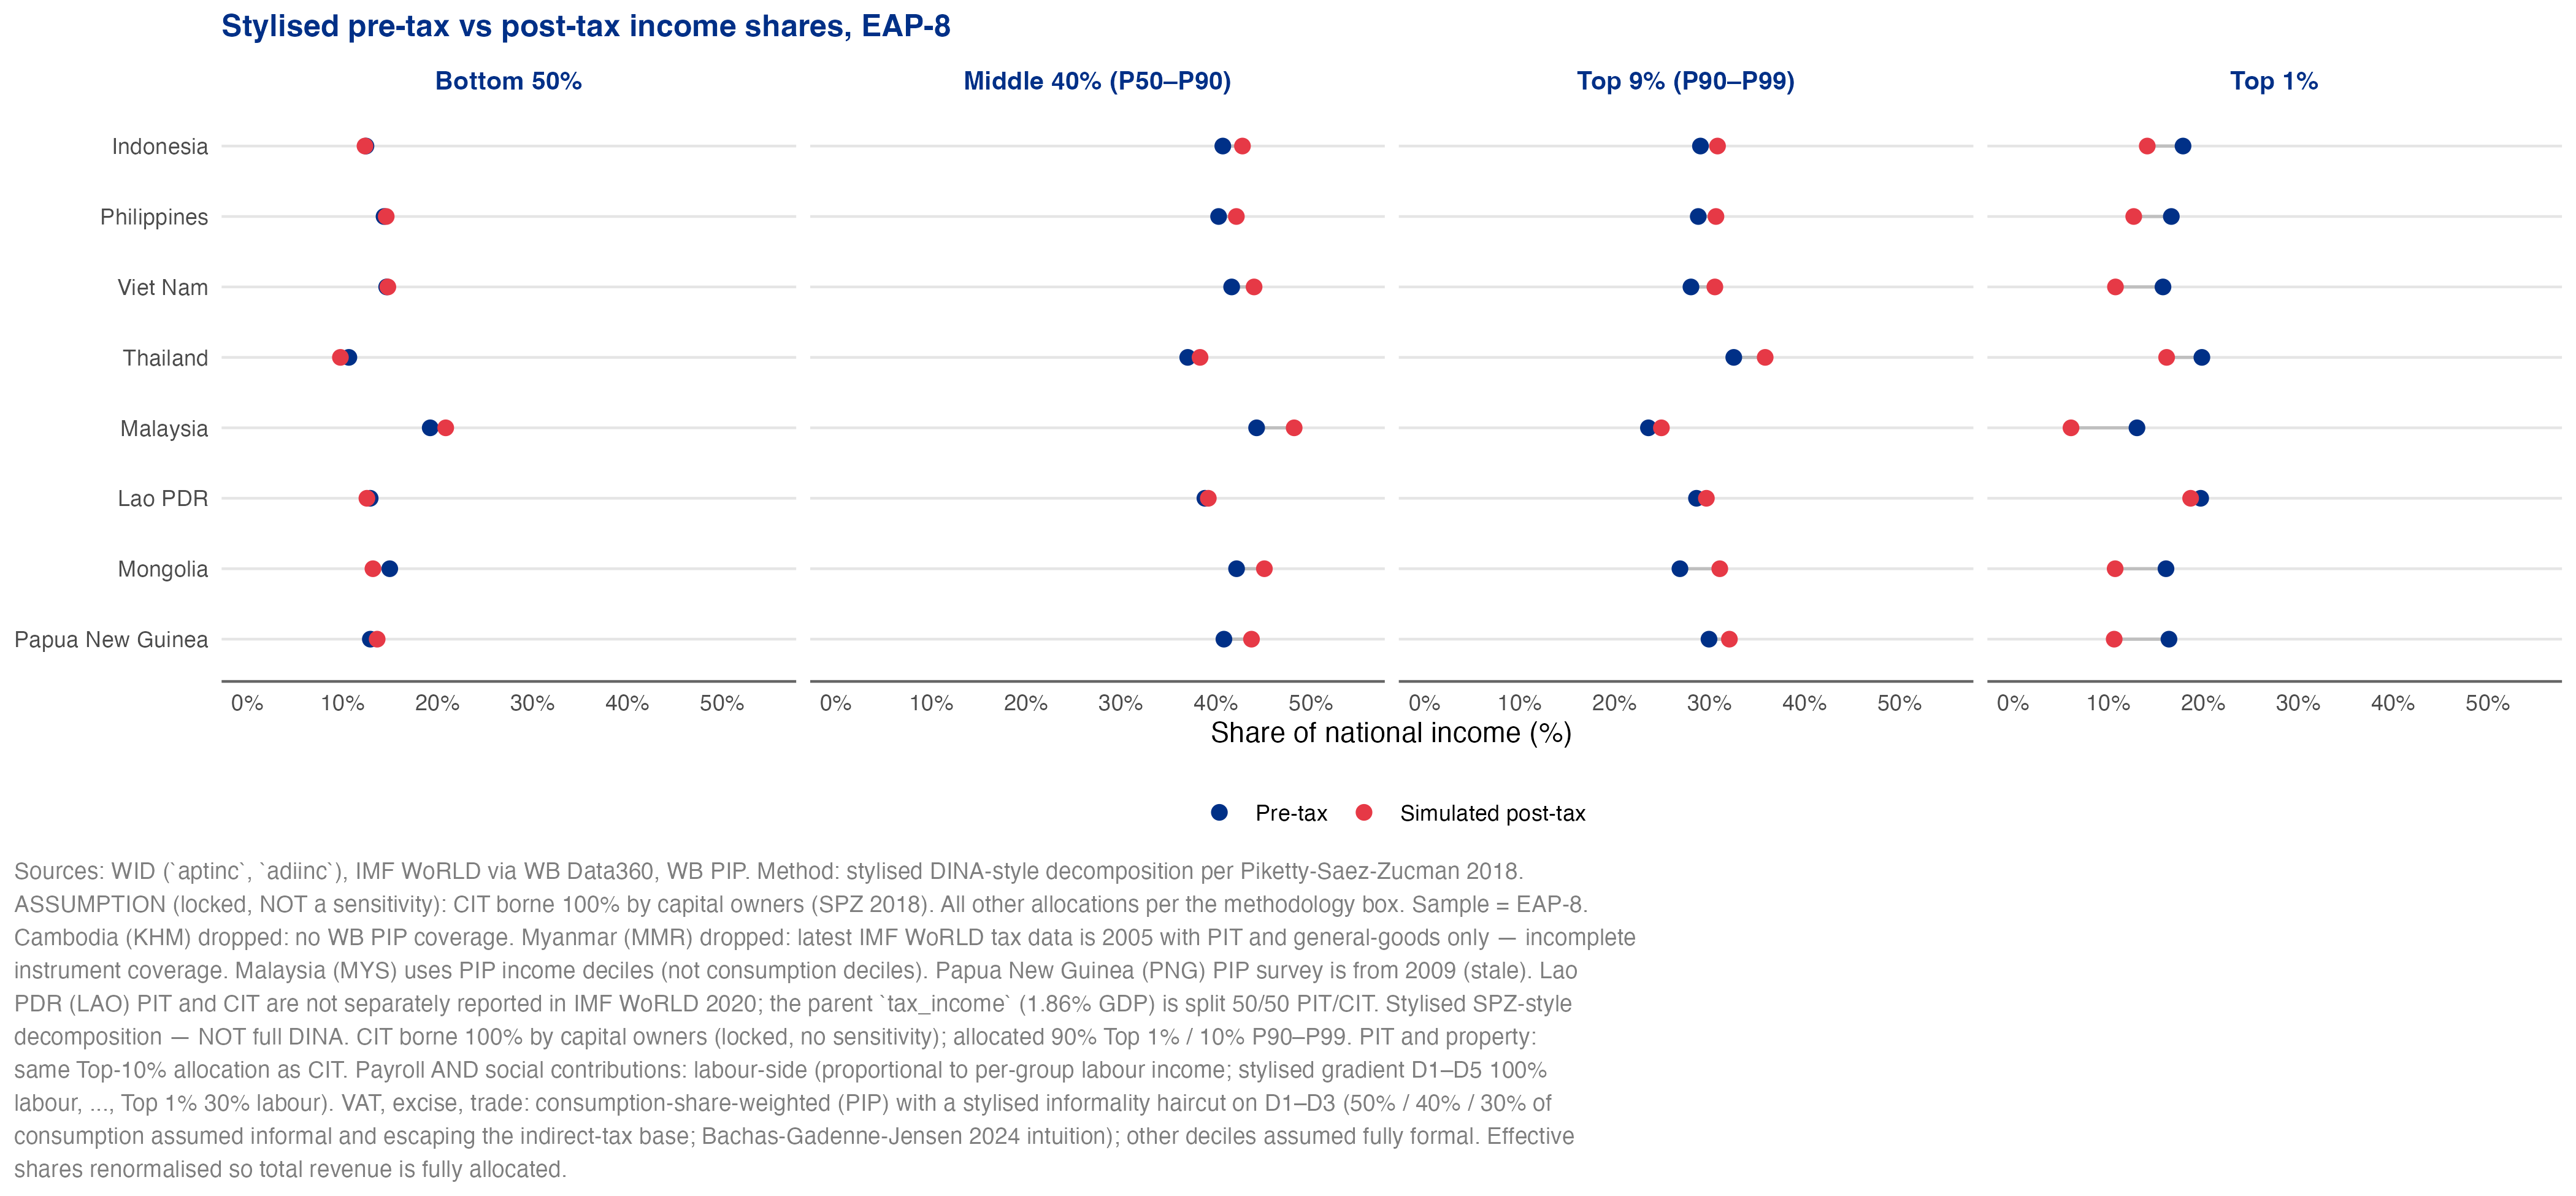
The post-tax simulation
For 8 EAP economies (IDN, PHL, VNM, THA, MYS, LAO, MNG, PNG) we build a stylised pre-tax to post-tax decomposition under fixed incidence rules: CIT borne 100% by capital owners; capital taxes split 90/10 between the Top 1% and P90–P99; VAT allocated by consumption with an informality haircut on the bottom three deciles; PIT allocated by tax-record-style top-share rules.
Findings
- Benefits of growth captured by the top 10% and even more by the top 1% in most EAP economies, with the bottom 50% capturing only a small share of growth.
- The role of taxation in redistributing income is not clear, but the stylised simulation suggests that it has played a limited role.
- We cannot answer how much consumption tax, income tax, excise tax, CIT or property each decile pays as a share of its income.
Not only fairness reasons to care about this, but also efficiency and political reasons: citizens find it hard to consent to a tax system whose distributional consequences they cannot see.