We plot tax-to-GDP ratios across EAP over the past two decades and check whether the WB's recommendations track the realised revenue path at country and instrument level.
Headline: Tax/GDP has been broadly flat across EAP
since 2010 despite sustained advisory engagement. Some Prior Actions
are misaligned with realised tax revenue at country level. The
flatness is hard to explain by the quantity of advice — it points
to factors beyond instrument design.
Tax revenue has been broadly flat
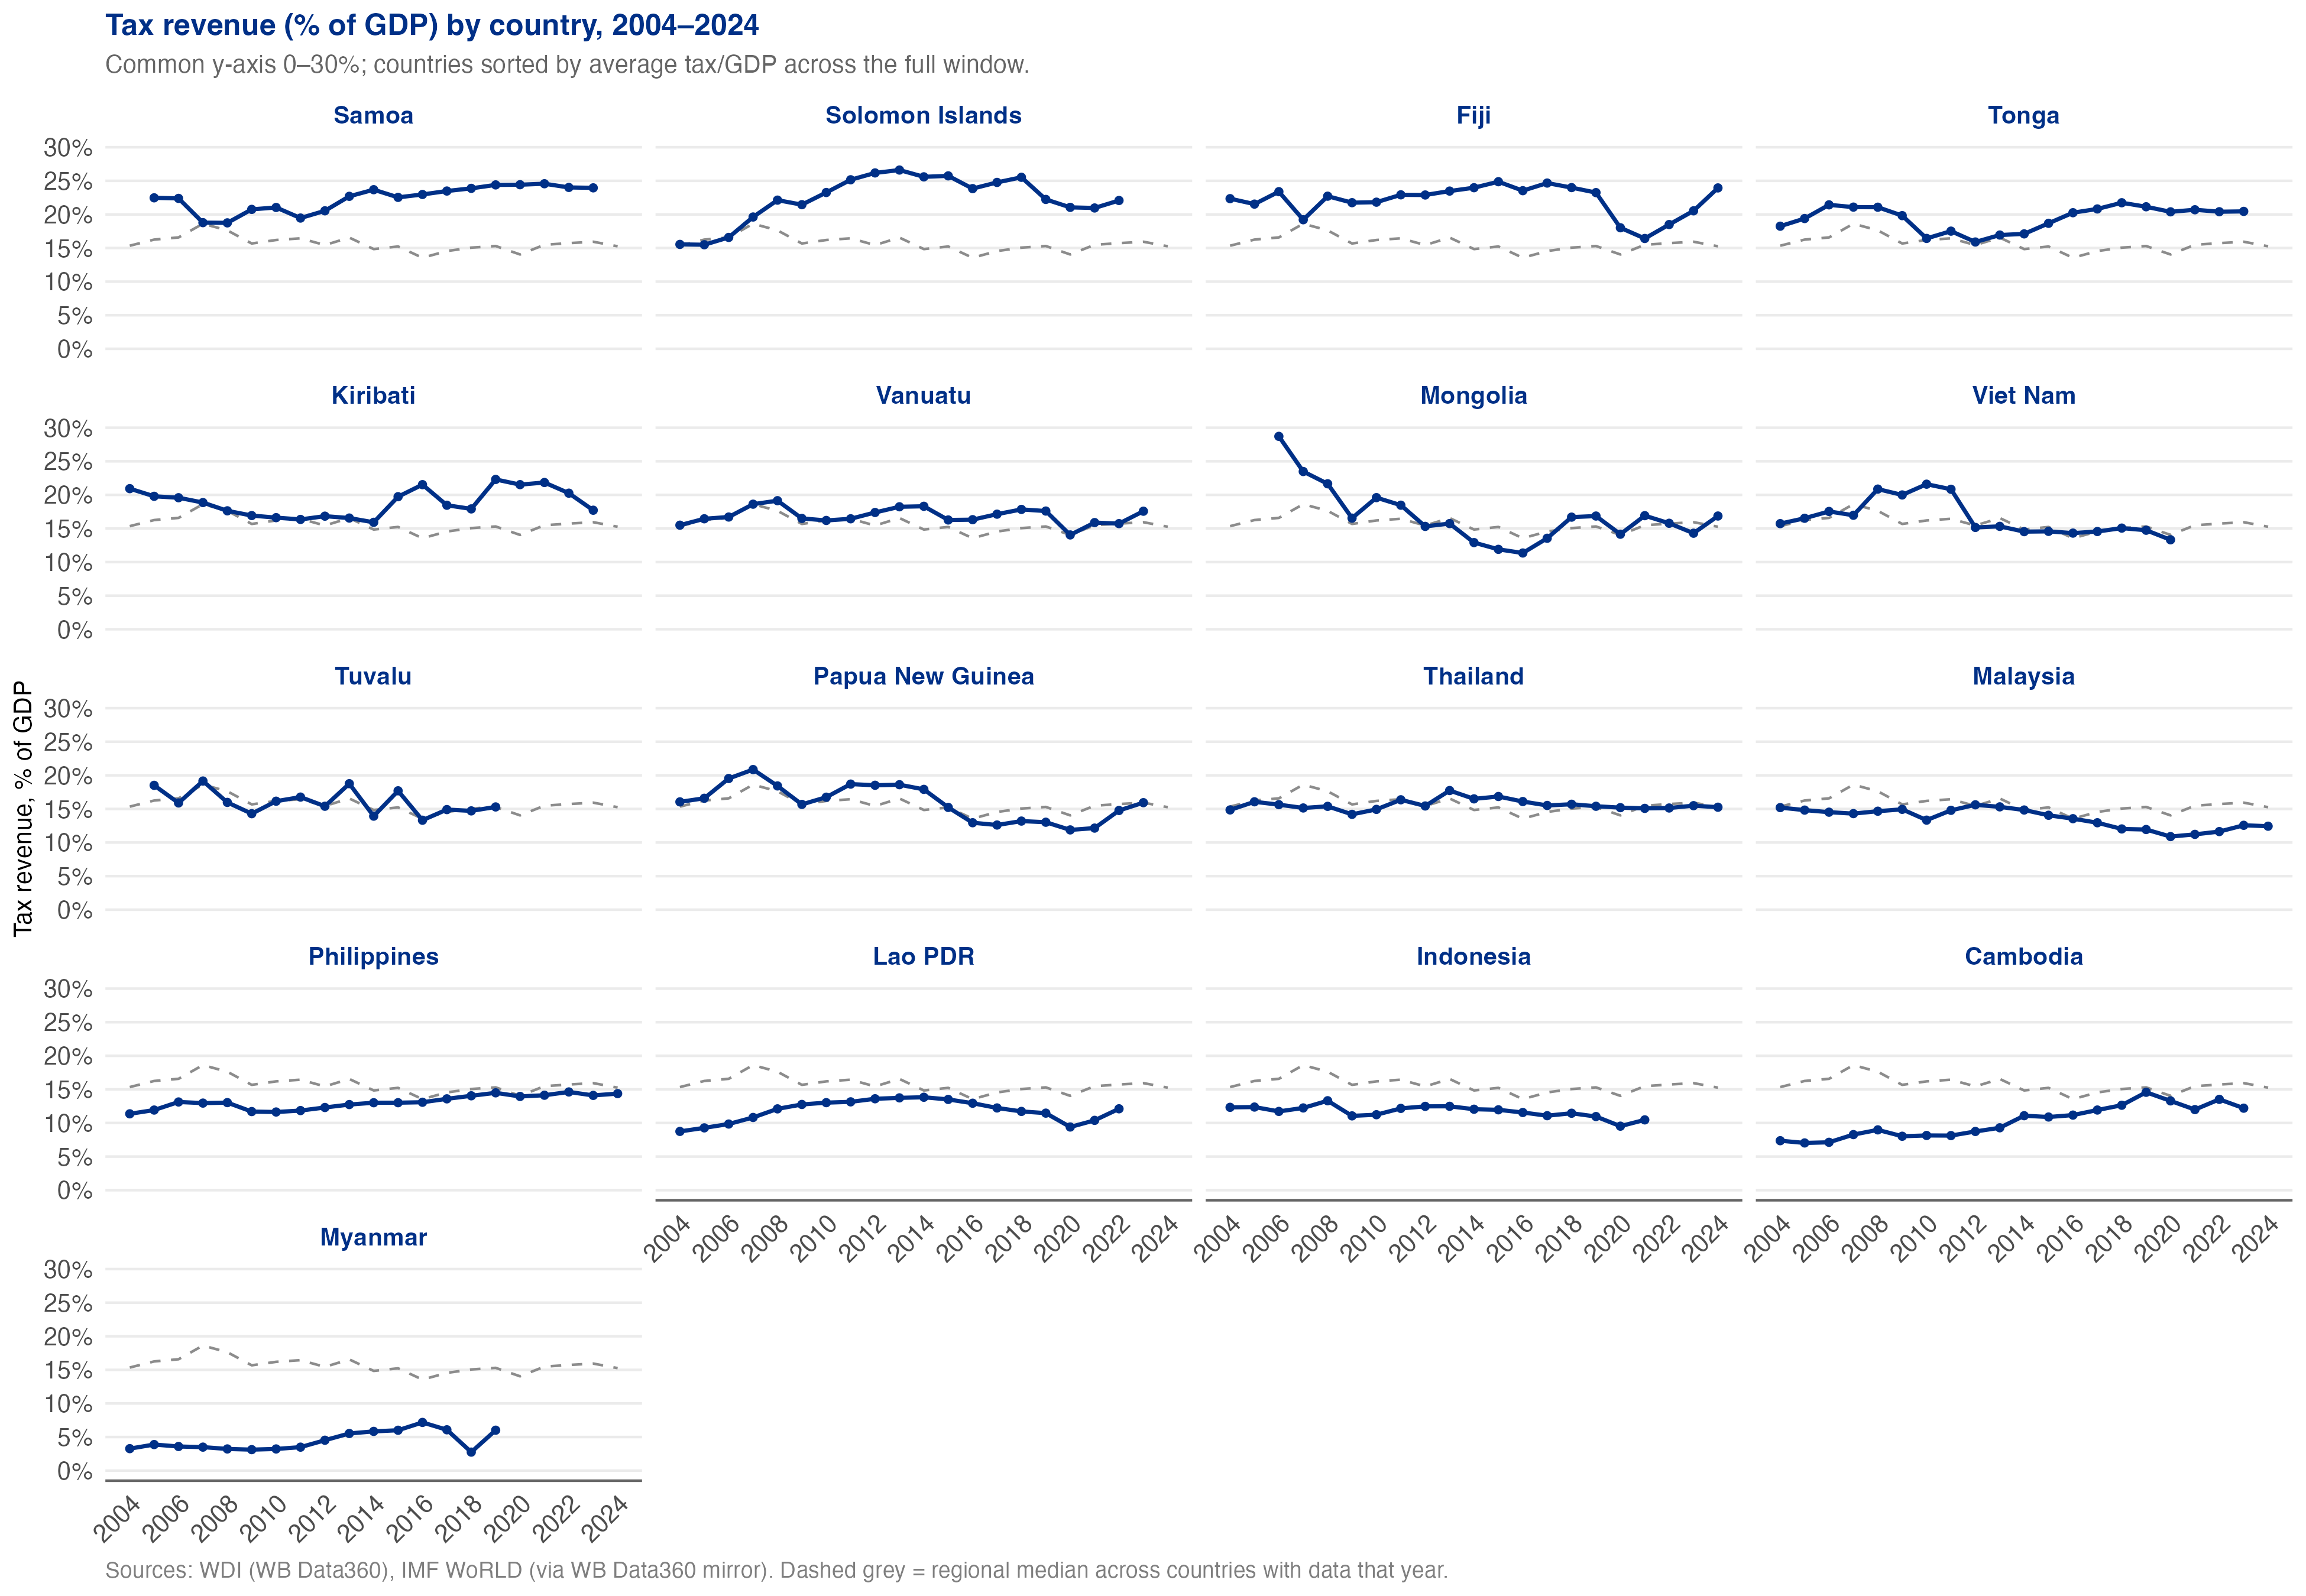
Tax revenue (% of GDP) by country, 2004 onwards. Pacific
economies sit at 20–25%, Southeast Asia at 12–17%, Indonesia at
10–11% for two decades, Myanmar at 6% and falling.
Composition has barely moved
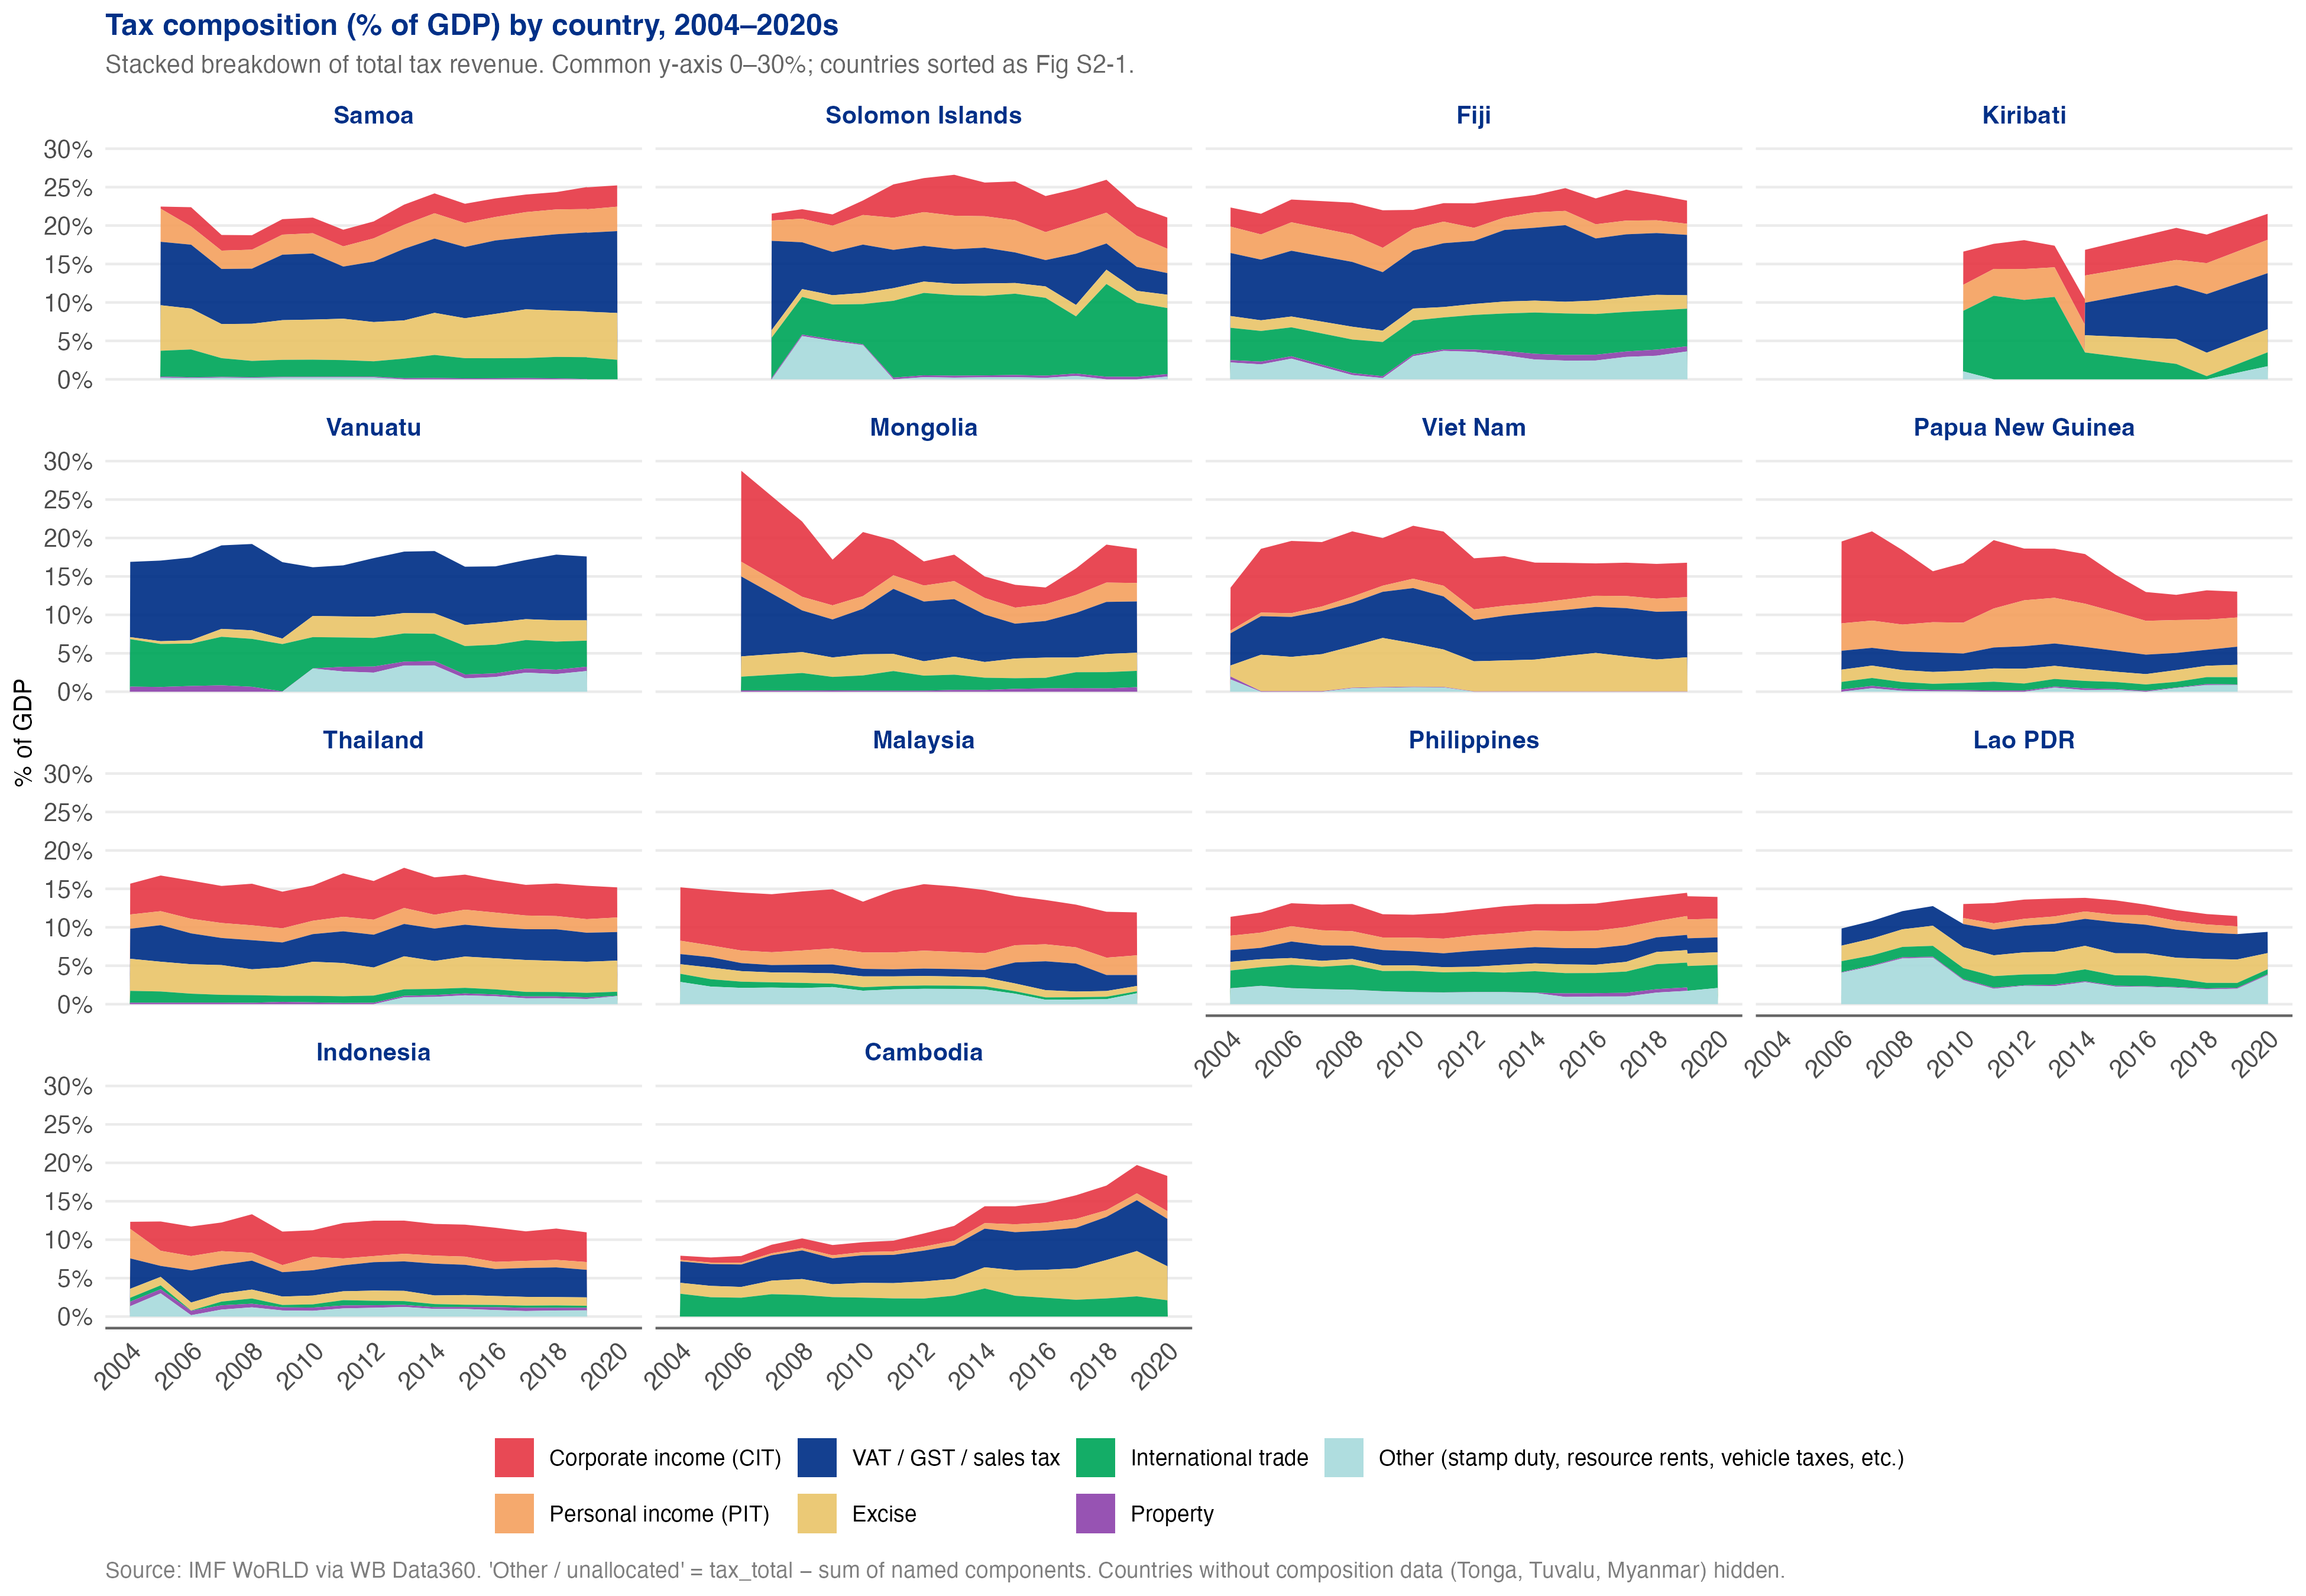
Tax composition (% of GDP) by country, 2004–2020s.
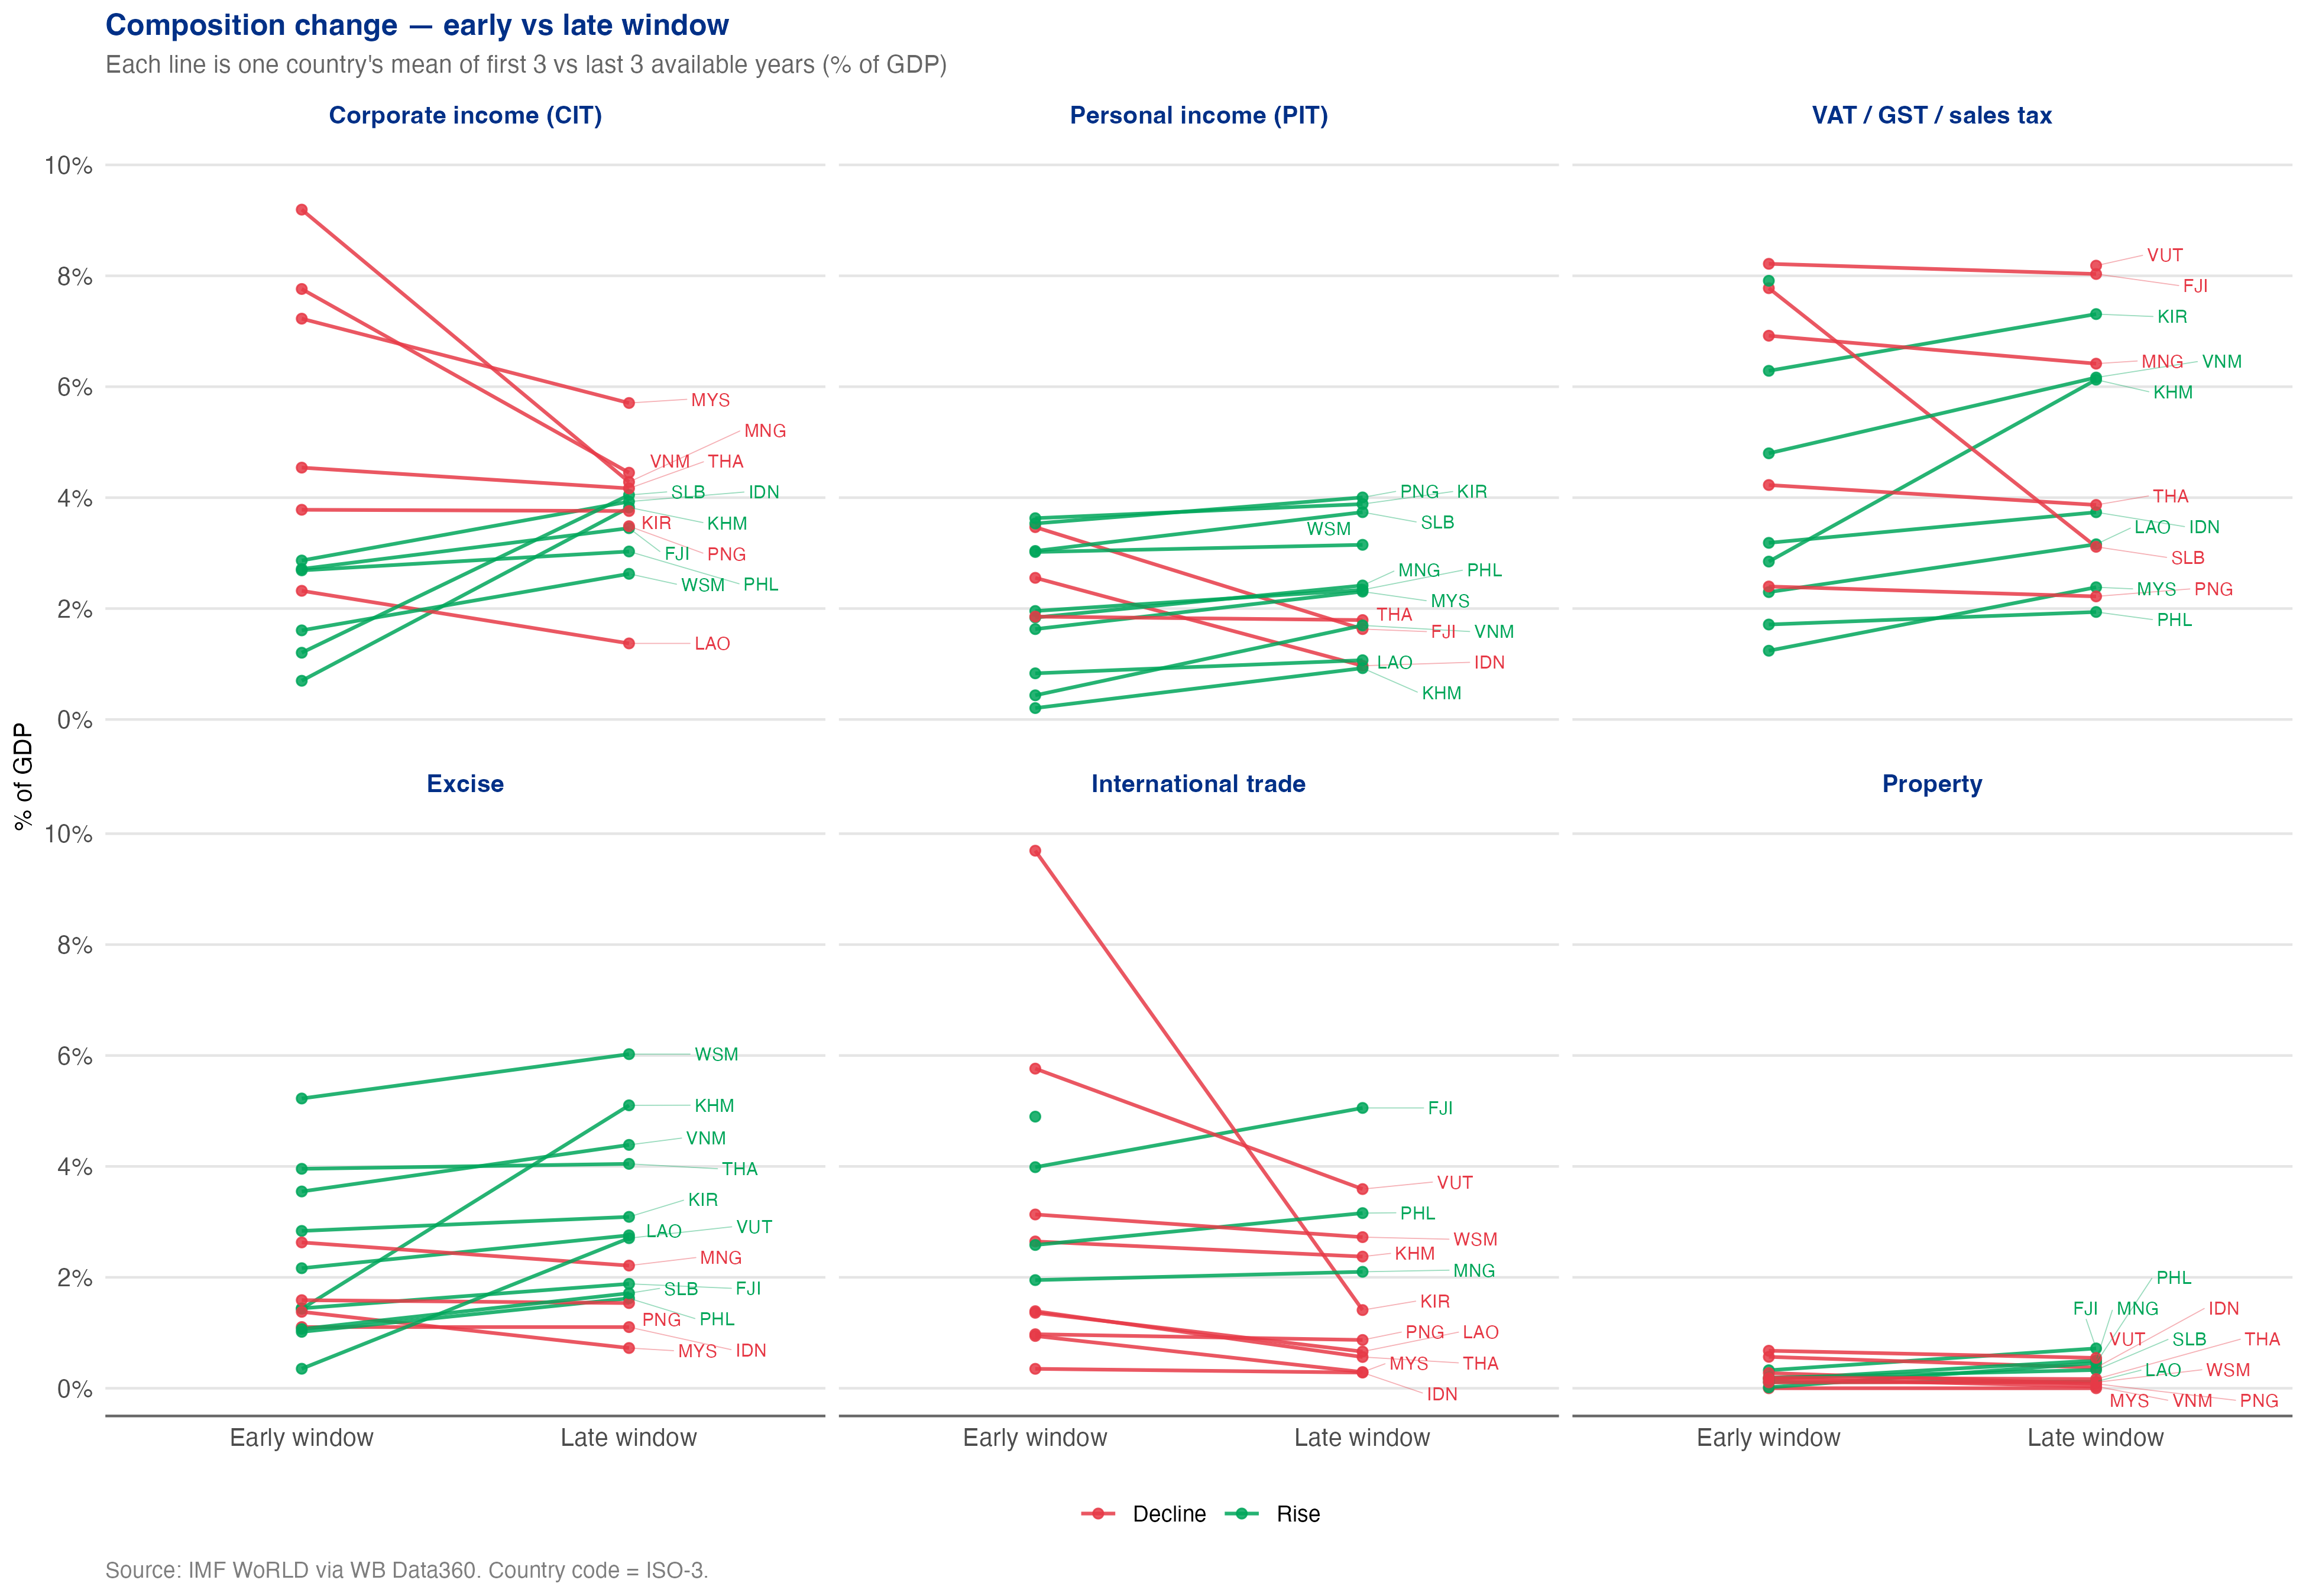
Composition change between early and late window. Most countries
cluster on the 45-degree line — composition is stable.
Alignment with the recommendations
Each DPF prior action with a clear revenue-raising or revenue-cutting
direction is plotted against the realised total tax/GDP move in the
3-year post-mean minus 3-year pre-mean window. Each square = one
prior action; the inner glyph (+ raise, −
cut) shows the recommended direction; the colour shows whether
realised revenue moved in that direction.
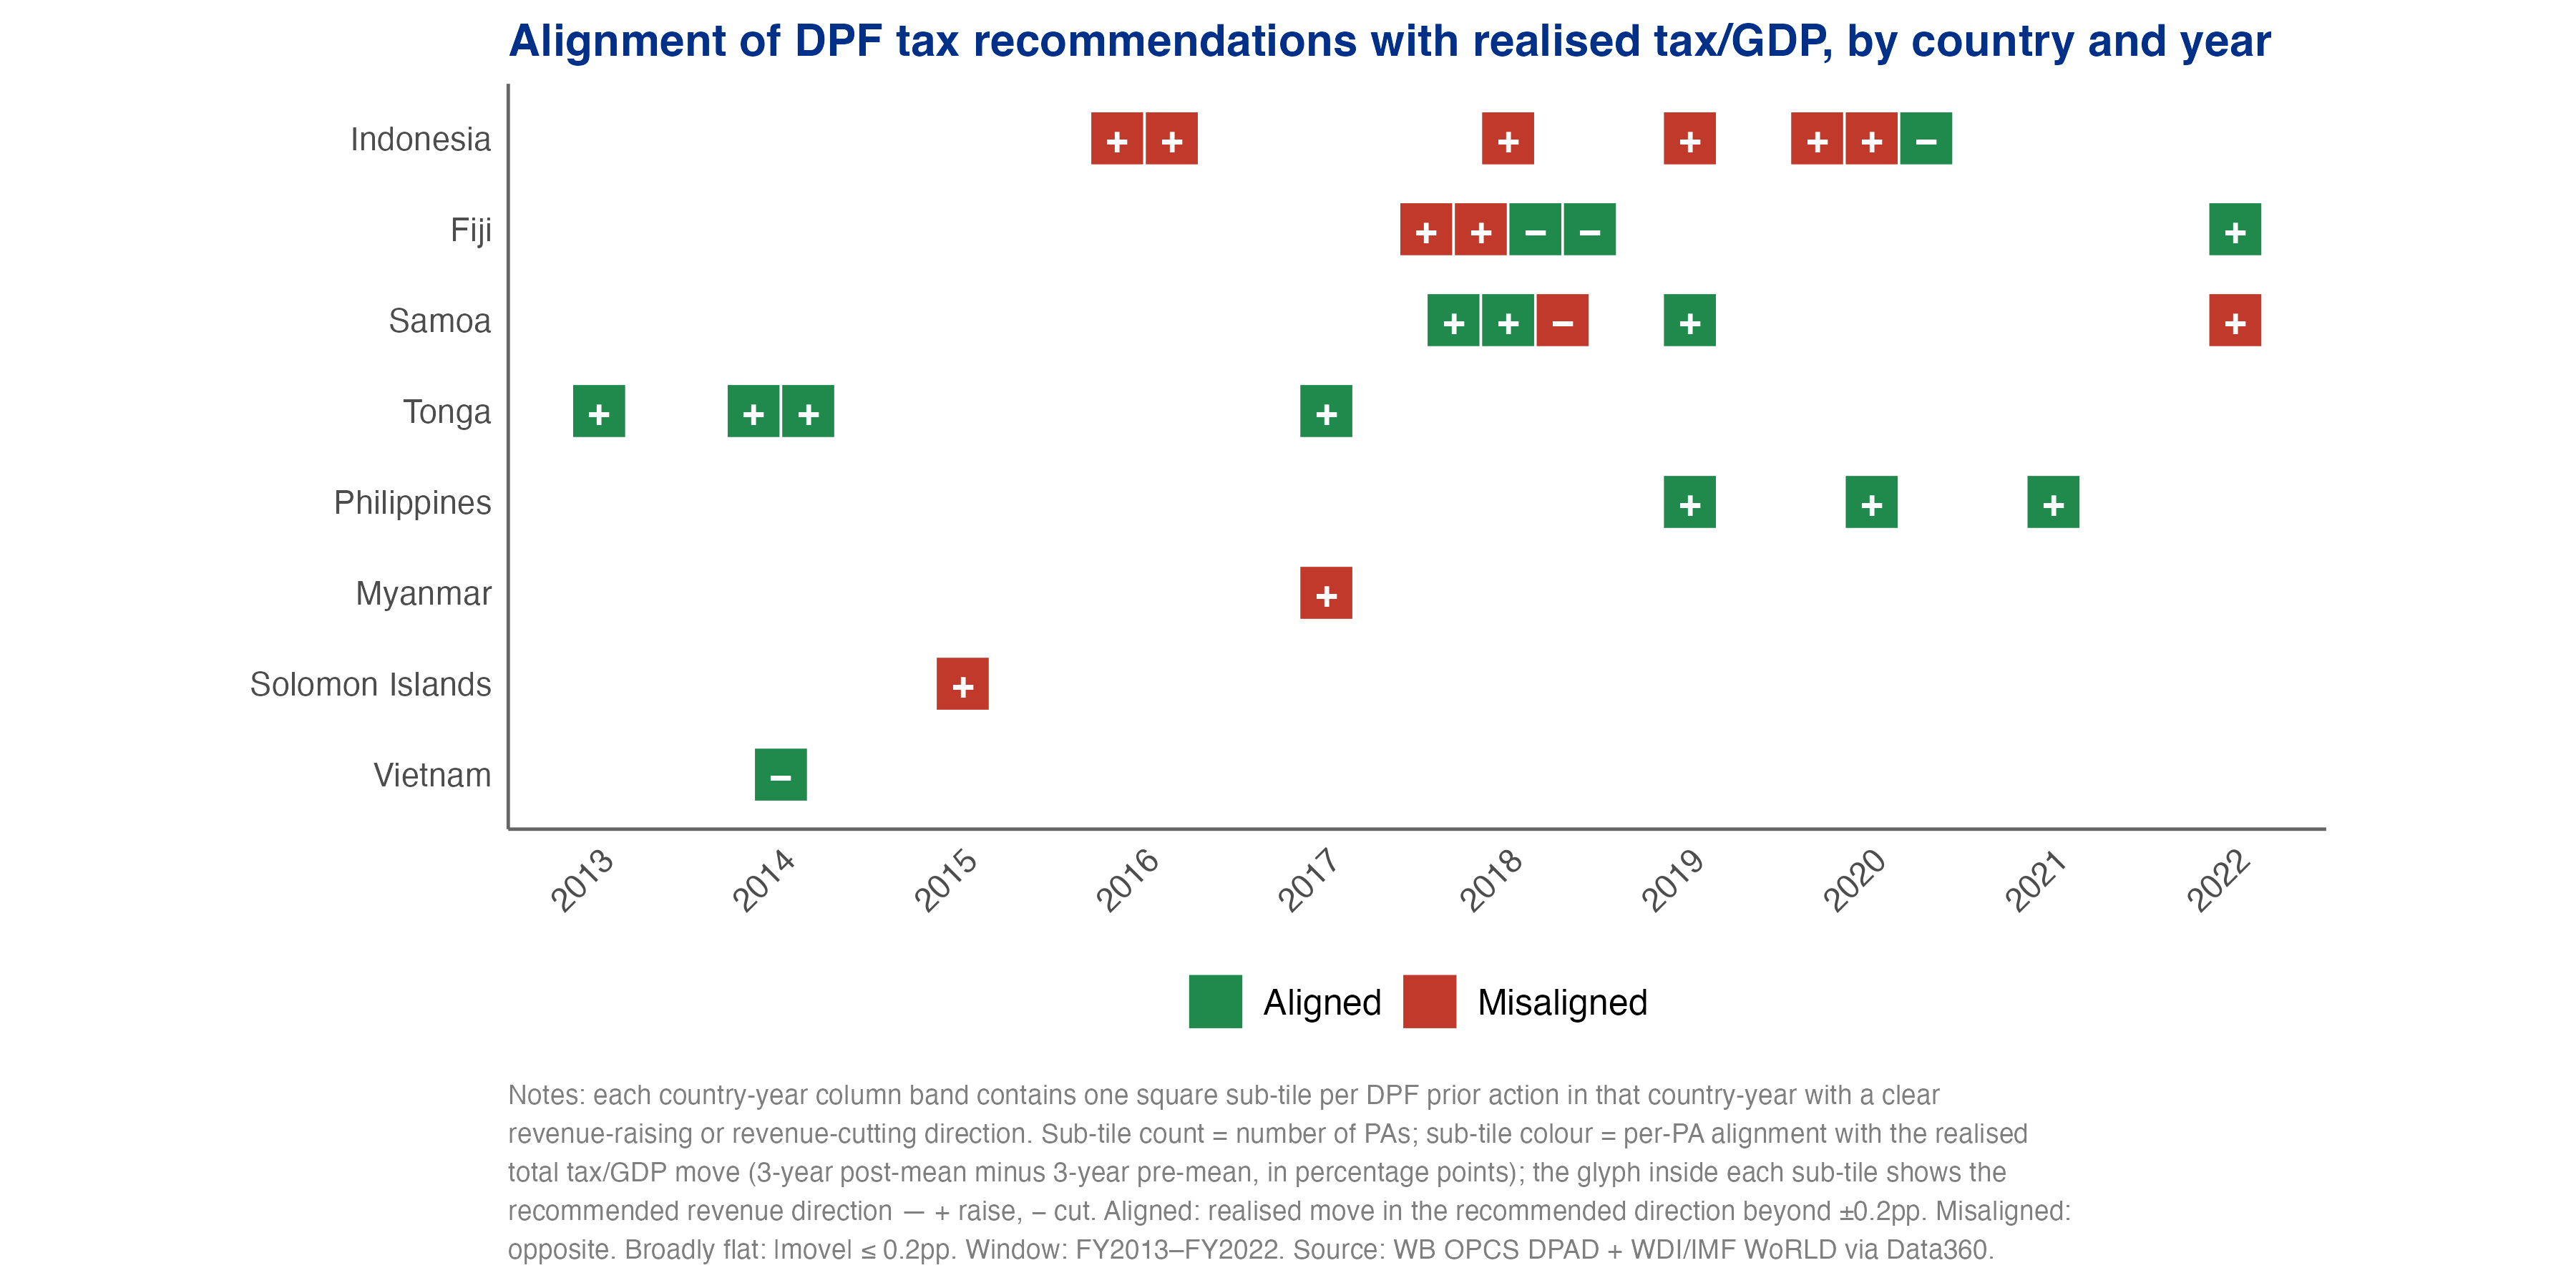
Alignment of DPF tax recommendations with realised tax/GDP, by
country and year, FY2013–FY2022. Indonesia is the most striking
case: six revenue-raising prior actions across FY2016–FY2020,
all six in misaligned cells.
Findings
- Despite high growth and a stable macro environment, tax/GDP has not moved in EAP — surprising given the volume of advice and the region's wider development gains.
- Some Prior Actions are misaligned with realised tax revenue at country level. Whether this reflects advice that did not bind, or advice that was implemented but insufficient to move the headline series, is an open question.
Source files
All figures
19 PNG files
Trend, composition, alignment heatmaps + presentation variants.
Code
9 R scripts
Includes the alignment-revisit pipeline with audited direction-sign overrides.
Next: Section 3 — Inequality →